Visualization of Results
Plotting Maps
After calculating the maps, there will be a number of options for
plotting. The xanespy.xanes_frameset.XanesFrameset object
has a number of methods for plotting the maps. Many of these method
use the map_name argument to The
xanespy.xanes_frameset.XanesFrameset.plot_map() method will
prepare a plot of any of the maps.
Interactive (Qt) Viewer
Xanespy includes a graphical user interface that allows for
interactive visualization of X-ray frames and maps. The viewer is
launched from the command line and takes the path to a processed HDF
file as its input. For some extra functionality, you can give the name
of a metal K- of L- edge using the -k or -l argument
respectively. See xanespy-viewer --help for a list of K and L
edges available.
$ xanespy-viewer results/beamtime-analysis.h5 -k Ni
The data tree on the left of the window shows the possible datasets than be viewed. Choosing an entry with type “frameset” will load and plot the frames, spectra and histograms in the frame window. If a “map” entry is selected, the map window will be launched and the frames that went into making the map will be shown in the frame window.
In the interest of encouraging reproducibility, the ability to
export plots has been intentionally left out. Any options selected
in the GUI can be passed into the plot_map, plot_histogram or
plot_spectrum methods of the frameset object. The name of the
entry in the data tree is given as the keyword argument
representation.
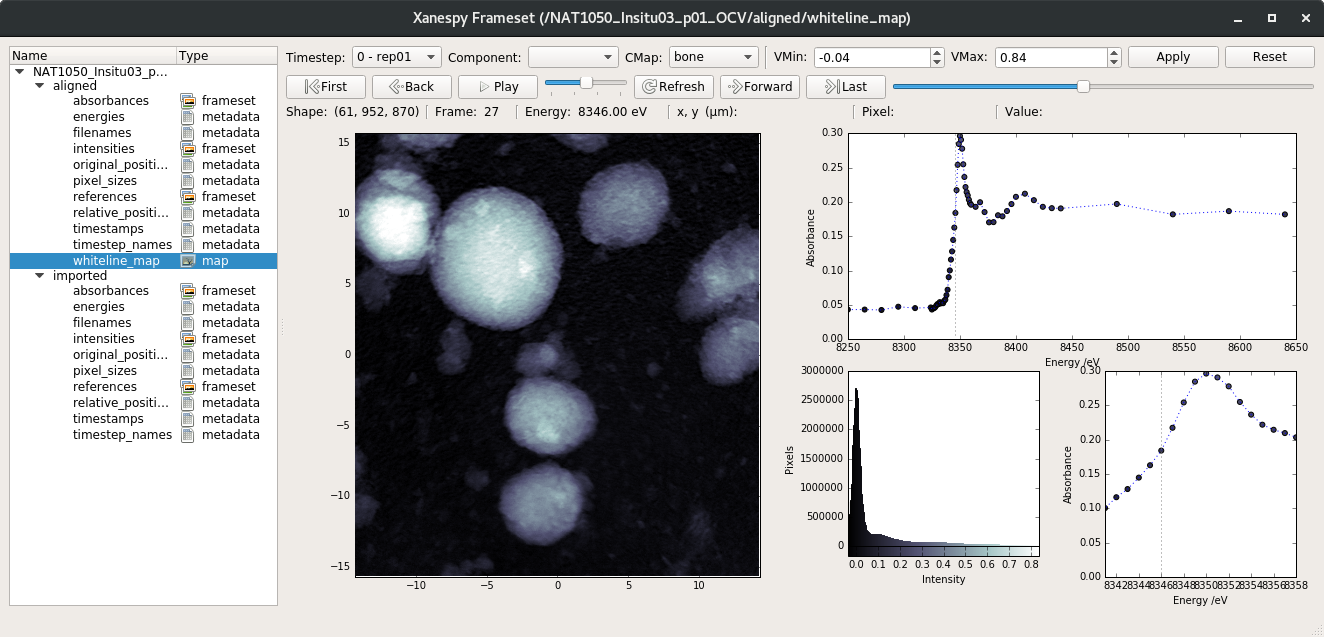
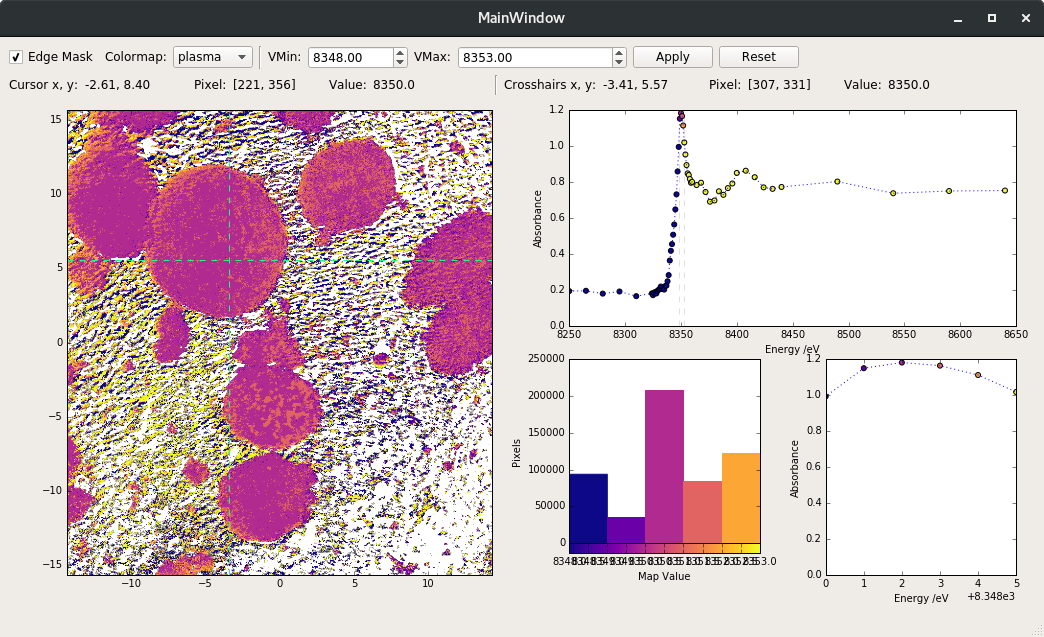
Screenshots of the Qt viewer. Frame window (top) and map window (bottom).